Schedule a Free Demo
No obligation • Takes less than a minute
CMMS Reporting, Dashboards & KPIs
CMMS Reporting, Dashboards & KPIs is the eWorkOrders capability that converts raw maintenance data — work orders, assets, labor, parts, and costs — into customizable reports, live dashboards, and tracked key performance indicators so maintenance managers can measure what's happening, identify what's wrong, and make decisions based on facts rather than estimates.
eWorkOrders gives maintenance teams a complete reporting and analytics platform — generate pre-built or custom reports, monitor MTTR, MTBF, PM compliance, and planned vs. unplanned ratios on live dashboards, and track the KPIs that matter to your operation. Every number is pulled directly from work order and asset data captured in the system — no spreadsheets, no manual tallying.
You can't improve what you can't measure. eWorkOrders puts the numbers in front of the people who need them.
Customers Love Us!


Reporting & Dashboard Features in eWorkOrders
Each section below describes what the feature does and how it works in eWorkOrders.
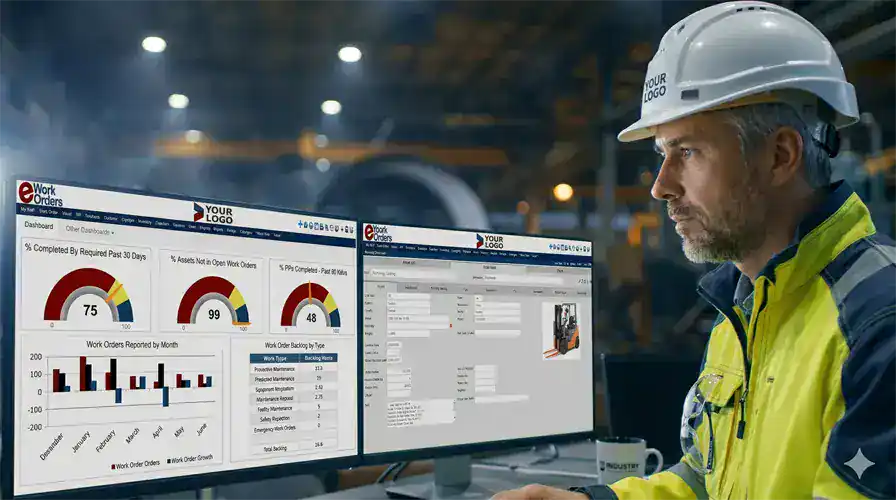
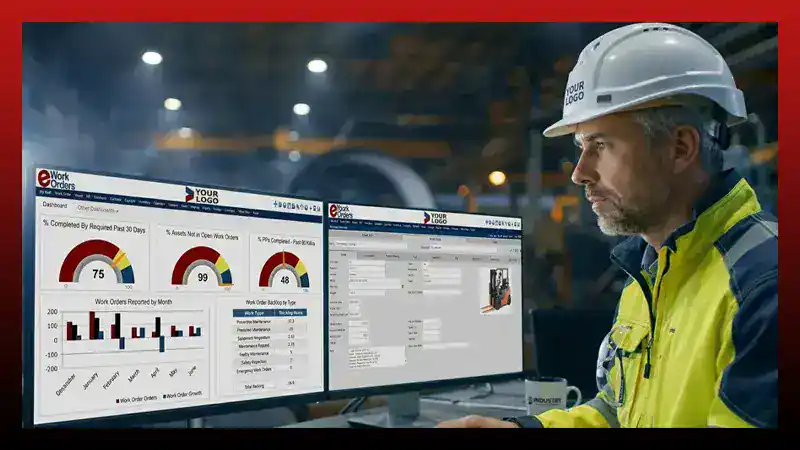
Configurable Dashboards Display Real-Time Maintenance Data the Moment It Changes
The eWorkOrders dashboard displays current work order status, open jobs by priority, PM completion rate, downtime instances, technician workload, and any escalation flags — all updated in real time as technicians log activity from the field or office. No manual refresh, no end-of-day data pull.
Each user can configure their own dashboard with the widgets that matter to their role. A maintenance manager may want backlog by age and cost per asset; a technician may want their open jobs queue. Dashboards can also be shared across teams and set as the default login screen so the data is front-and-center the moment anyone opens eWorkOrders.
Generate, Schedule, and Export Reports Covering Every Aspect of Maintenance Operations
eWorkOrders includes a library of pre-built report templates covering work order status and history, PM compliance, asset downtime, labor hours by technician, parts consumption, vendor performance, and cost analysis by asset or department. Each report can be filtered, sorted, and date-ranged to produce exactly the view you need.
The custom report builder lets you design reports around your specific fields, assets, and workflows without requiring IT support. Reports can be scheduled to generate and distribute automatically to stakeholders on a daily, weekly, or monthly basis — exported to PDF or spreadsheet format for budget reviews, compliance audits, or executive presentations.
Define, Track, and Visualize the KPIs That Matter to Your Maintenance Program
eWorkOrders calculates maintenance KPIs directly from the data recorded on work orders and asset records — no manual calculation, no spreadsheet formulas. MTTR, MTBF, PM compliance rate, planned vs. unplanned maintenance ratio, work order backlog, schedule compliance, cost per asset, and technician productivity are all available as tracked metrics with historical trending.
KPI widgets can be added to any dashboard, set with target thresholds, and monitored over time. When a metric moves outside its target range, it's visible immediately — before it becomes a problem. This is the mechanism by which maintenance programs shift from reactive to planned: you see the planned vs. unplanned ratio, you know where to focus, and you can demonstrate progress month over month.
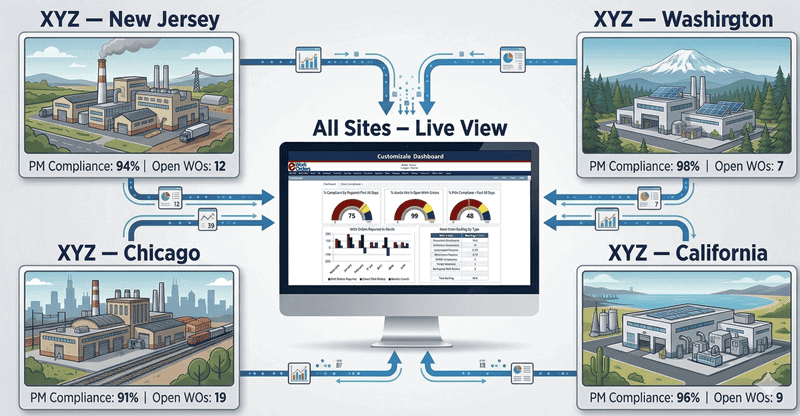
Report Across All Sites and Locations From a Single Dashboard View
Organizations managing maintenance across multiple buildings, plants, or locations can view all sites together or filter reports and dashboards to a single location. KPIs are calculated per site, per asset class, or across the entire portfolio — so underperforming locations are visible immediately rather than buried in aggregate data.
Multi-site reporting in eWorkOrders means maintenance directors, regional managers, and facility executives can monitor performance at every location without contacting individual site managers. Budget reviews, compliance audits, and operational benchmarking across locations all draw from the same live data.
What Is CMMS Reporting, and Why Do Maintenance KPIs Matter?
CMMS reporting is the process of converting the data captured in a Computerized Maintenance Management System — work orders, labor hours, parts used, asset history, PM completions — into structured reports, live dashboards, and tracked metrics that allow maintenance managers to evaluate program performance and make informed decisions. Without it, a maintenance operation is managed by gut feel, verbal updates, and the assumption that work is getting done correctly.
Key Performance Indicators (KPIs) in maintenance include metrics like Mean Time to Repair (MTTR), Mean Time Between Failures (MTBF), PM compliance rate, planned vs. unplanned maintenance ratio, work order backlog, cost per asset, and technician utilization. These numbers answer specific questions: How quickly is the team responding to failures? How reliable are critical assets? Is the maintenance program shifting toward planned work or stuck in reactive mode? According to McKinsey research published on mckinsey.com, organizations in asset-intensive industries that digitize and apply analytics to their maintenance operations achieve 18–25% reductions in maintenance costs and 5–15% increases in asset availability — outcomes that depend entirely on having accurate, current data to act on.
The difference between having data and using it: Many CMMS systems capture data but bury it in static tables that require manual export and manipulation. eWorkOrders makes reporting and KPI visibility part of the daily workflow — live dashboards, automatically calculated metrics, and scheduled reports that go to the people who need them, without anyone having to request them.
See eWorkOrders Reporting in Action — Live Demo, No Commitment
Our US-based team builds every demo around your facility type, team size, and the specific KPIs your operation needs to track.
What Maintenance Managers Can Measure in eWorkOrders
Every KPI in eWorkOrders is calculated from real work order and asset data — not entered manually or estimated. The table below shows the key metrics available and what each one tells you.
| KPI / Metric | What it measures | How eWorkOrders calculates and displays it |
|---|---|---|
| MTTRMean Time to Repair | Average time to restore equipment after a failure — lower is better | Calculated from work order open and close timestamps. Displayed as a trend line on the dashboard. High MTTR indicates slow response, parts shortages, or inadequate job plans — all traceable in the associated work order records. |
| MTBFMean Time Between Failures | Average operating time between unplanned failures — higher is better | Calculated per asset from failure work order history. Rising MTBF confirms that PM programs are reducing failure frequency. Falling MTBF on a specific asset signals that PM schedules or maintenance procedures need review. |
| PM Compliance RatePreventive maintenance completion | Percentage of scheduled PMs completed on time — target is 90%+ | Calculated from PM work order completion data against scheduled due dates. Displayed as a percentage on the dashboard. Consistent slippage in PM compliance is a leading indicator of increasing unplanned failures — visible here before it shows up in MTBF. |
| Planned vs. Unplanned RatioMaintenance strategy balance | Share of maintenance work that is scheduled vs. reactive — target is 80% planned | Derived from work order type classification (planned PM vs. corrective/emergency). NIST research shows manufacturers relying on preventive and predictive maintenance have 52.7% less unplanned downtime than reactive-maintenance-heavy operations (Thomas & Weiss, NIST AMS 100-34, 2021). This ratio is the primary indicator of program maturity — and eWorkOrders tracks it automatically. |
| Work Order BacklogOverdue and pending work | Open work orders by age, priority, and assignment status | Displayed on the dashboard as a count and breakdown by priority and age bucket. A growing backlog of overdue or unassigned work is visible before it creates equipment risk. Managers can filter by technician, asset, or location to identify where the backlog is concentrated. |
| Cost per AssetMaintenance spend by asset | Total labor and parts cost attributed to a specific asset over time | Labor hours and parts costs logged on work orders are automatically summed per asset. Cost history reports show which assets are consuming the most maintenance budget — supporting replacement vs. repair decisions with actual cost data rather than estimates. |
| Technician ProductivityLabor performance tracking | Work orders completed, labor hours logged, and estimated vs. actual time per technician | Labor time entries on work orders feed technician productivity reports. Managers can see time estimates vs. actual time, completion rates, and job distribution across the team. Reports can be filtered by date range, technician, or asset type for performance reviews and resource planning. |
Every Reporting Capability Your Maintenance Program Needs
From daily work order tracking to long-term asset cost analysis, eWorkOrders reporting covers the full picture — in real time, not at the end of the month.
Each user builds their own dashboard with widgets relevant to their role — work order queue, PM compliance rate, backlog by priority, cost trending, or technician workload. Dashboards can be shared with teams or set as the default screen on login. Settings are retained between sessions.
eWorkOrders includes built-in report templates for work order status and history, PM completion, asset downtime, labor time by technician, parts usage, vendor performance, and cost analysis. Each template can be filtered by date range, location, asset type, or technician — and exported to PDF or spreadsheet.
Build reports around the specific fields, assets, and workflows that matter to your operation. Choose the data points, apply filters, define groupings, and save the report for reuse. No IT support required — maintenance managers can create and modify their own reports directly in eWorkOrders.
Add KPI widgets to any dashboard — MTTR, MTBF, PM compliance, planned vs. unplanned ratio, backlog count, cost per asset, and more. Set target thresholds so metrics that fall outside acceptable ranges are immediately visible. Historical trend lines show direction of change over weeks, months, or quarters.
Reports can be scheduled to generate and distribute automatically at defined intervals — daily, weekly, or monthly. Stakeholders receive the reports they need without having to request them or log into the system. This keeps facility directors, operations managers, and finance teams informed without adding work for the maintenance team.
Labor hours and parts costs are logged on every work order and summed automatically per asset, department, job type, or location. Cost reports give maintenance managers the data they need to justify budgets, identify high-cost assets that are candidates for replacement, and demonstrate maintenance ROI to operations and finance leadership.
Every completed work order generates a timestamped record of what was done, by whom, with what parts, and with what outcome. Compliance reports draw from this data to support FDA, OSHA, ISO, JCAHO, and regulatory audit requirements. Documentation is created at the point of work — not assembled before an audit.
View work order completion rates, labor hours logged, estimated vs. actual time, and job distribution per technician. Reports can be filtered by date range, job type, or location for performance reviews, shift planning, and labor cost analysis. Time is captured on the work order as jobs are executed — not self-reported afterward.
Every work order completed on an asset is logged to that asset's maintenance history. Asset performance reports show failure frequency, repair costs, downtime hours, and PM compliance per asset over any time period. This data supports capital planning — replacing a high-cost asset with data behind the decision rather than a gut feeling.
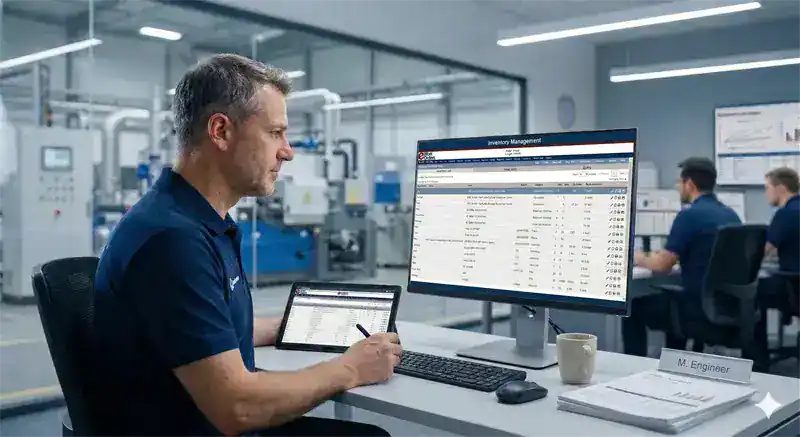
Parts usage is logged on work orders and tracked against inventory records. Inventory reports show parts consumed per job type or asset, stock levels, reorder activity, and carrying costs. This data supports storeroom optimization — avoiding stockouts on critical parts and reducing inventory carrying costs on parts that rarely get used.
View reports and dashboards for all locations combined or filter to a single site. Compare KPIs across facilities — PM compliance at Site A vs. Site B, cost per asset at each plant, backlog by location. Multi-site reporting gives operations and facility executives the visibility to manage performance across a portfolio without consolidating data manually.
The eWorkOrders AI assistant surfaces patterns in maintenance data — recurring failures on specific assets, rising repair costs before they spike, PMs that are consistently delayed on certain lines. Insights are presented in the context of work order history so managers can act on findings directly rather than interpreting raw data.
How Reporting and KPIs Work in eWorkOrders — From Daily Operations to Monthly Review
This is what the reporting and analytics workflow looks like in eWorkOrders — how data captured during daily maintenance activity becomes the metrics that drive decisions.
Every time a technician opens a work order, logs labor time, records a failure code, closes a job, or marks a PM complete — that activity is recorded in eWorkOrders with a timestamp and associated with the asset, location, and work order type. This is the raw material for all reporting and KPI calculation. Nothing needs to be re-entered or summarized separately. The act of doing maintenance creates the data that measures it.
As technicians work through jobs during the day, the manager's dashboard reflects current status without any manual update. Open work orders, jobs in progress, PM completions, and overdue items are all visible in real time. The dashboard is the day-to-day operational view — not a summary that appears at end of shift. Managers can see where the team is, what's falling behind, and what needs attention without making a single phone call.
eWorkOrders continuously calculates MTTR per asset and per technician, MTBF per asset, PM compliance rate, planned vs. unplanned ratio, and backlog age from the work order data in the system. These metrics update as jobs close. No spreadsheet formulas, no manual data pulls. The KPI dashboard shows where each metric stands against its target threshold — and the trend direction over time.
Scheduled reports generate on a defined cadence and go directly to the stakeholders who need them. A facilities director might receive a weekly PM compliance summary across all buildings. A plant manager might receive a labor productivity report every Monday morning. The reports arrive in email without anyone in the maintenance department having to pull and format the data. This is where reporting stops being a burden and becomes a management tool.
Monthly maintenance reviews — cost vs. budget, asset reliability trends, PM compliance by site, technician performance — are built from work order data that was captured throughout the month. Managers pull the relevant reports, apply the necessary filters, and have a complete, accurate picture of what happened. High-cost assets appear in cost reports. Failing assets appear in MTBF reports. Overloaded technicians appear in labor reports. Every issue has data behind it.
When it's time to present maintenance budget needs to leadership or justify capital equipment decisions, the data is already in eWorkOrders. Cost per asset over three years, downtime hours by line, comparison of planned vs. emergency repair cost — all of it is reportable. eWorkOrders reporting transforms maintenance from a cost center with opaque spending into an accountable function with measurable performance. That shift matters for budgets, staffing decisions, and the long-term health of the equipment portfolio.
Why Maintenance Teams Choose eWorkOrders for Reporting and KPI Tracking
Built for maintenance since 1995. Reporting tools designed by people who understand what maintenance managers actually need to see — not just what looks impressive on a screenshot.
Starter ($380/mo) and Advanced ($480/mo) include unlimited technicians — add your entire maintenance team without touching your budget. No per-seat fees. Enterprise is priced per user for large multi-site operations needing advanced controls. See all plans →
Your system is live within 24 hours of signup. Most teams import their asset list, build their first PM templates, and run their first automated work order within a week. No months-long implementation. Our US-based onboarding team handles it with you.
PM Compliance Rate (world-class target: 90%+), Planned Maintenance Percentage (85–90%), and Emergency Work Order Rate (under 10%) display automatically — benchmarked against SMRP standards so you know exactly where you stand.1,2
Founded 1995. Purpose-built for maintenance teams. Built for customers, not investors. 120+ industry awards. 4.9 stars on Capterra, G2, and GetApp. Decisions driven by what makes the product better for maintenance teams.
When your team has a question about PM scheduling, checklist configuration, or meter reading setup — you call a knowledgeable person who picks up and responds within hours. The primary reason customers switch to eWorkOrders from larger platforms and stay for decades.
Enterprise-grade security with SSO, role-based permissions, complete audit trails, and one of the highest security ratings in the CMMS industry. Your PM records, asset data, and compliance documentation are protected to the same standard used by regulated industries.
1 eWorkOrders CMMS. KPI Benchmarks and Maintenance Performance Targets. eworkorders.com | 2 SMRP. SMRP Best Practice Metrics. smrp.org
Common Maintenance Reporting Challenges — and How eWorkOrders Solves Them
Most maintenance teams know they need better visibility into performance — the challenge is getting it without adding hours of manual data work to an already stretched team. The common reality is that data exists in work orders, but extracting meaningful insight from it requires spreadsheet exports, manual calculation, and reconciliation across multiple sources. According to McKinsey research (mckinsey.com), organizations that digitize and apply analytics to their maintenance operations achieve 18–25% reductions in maintenance costs — but only when they have accurate, current data feeding those decisions. eWorkOrders solves the reporting problem by making KPI calculation a byproduct of the daily maintenance workflow — not an extra task performed at end of month.
KPIs Calculated Manually in Spreadsheets
Maintenance teams that track MTTR, MTBF, or PM compliance manually spend hours every month exporting data, entering formulas, and reconciling numbers — only to produce a report that's already outdated by the time it's reviewed. eWorkOrders calculates every KPI automatically from work order data. The numbers are current the moment a job closes.
Organizations with mature CMMS reporting operate at roughly 60% planned work vs. 30% in operations without structured KPI tracking — the difference comes from seeing the planned vs. unplanned ratio and acting on it consistently (WorkTrek / ATS Research, 2024).
No Visibility Into Asset Failure Patterns
Assets that fail repeatedly consume a disproportionate share of maintenance resources, yet they're often invisible until a major failure forces attention. eWorkOrders asset performance reports surface failure frequency, rising repair costs, and declining MTBF per asset — so high-risk equipment can be addressed proactively, before the next unplanned outage.
82% of companies have experienced unplanned downtime in the past three years (Aberdeen Strategy & Research). CMMS asset reporting is how organizations identify which assets are driving that statistic before the next failure event.
Budget Justifications Based on Guesswork
Without accurate cost-per-asset data, maintenance managers present budget requests based on estimates and experience — and they lose credibility when leadership asks for specifics. eWorkOrders cost reporting gives managers the actual labor and parts expenditure per asset, per department, and per job type. Capital requests and budget justifications are built from numbers that can be audited.
NIST research shows manufacturers relying on preventive and predictive maintenance have 52.7% less unplanned downtime than those relying primarily on reactive maintenance (Thomas & Weiss, NIST AMS 100-34, 2021). Cost reporting in eWorkOrders makes this shift visible — giving maintenance managers the data to argue for investment in preventive work over reactive response.
Multi-Site Reporting Requires Manual Consolidation
Organizations managing maintenance across multiple locations typically receive separate reports from each site and spend time consolidating them manually to get a portfolio view. eWorkOrders multi-site reporting displays all locations in a single dashboard. Managers can compare PM compliance, backlog, and KPIs across sites without requesting reports or reconciling separate data sources.
"eWorkOrders has enabled us to become a data driven department. Our prior CMMS software could only tell us how many work requests/PMs we did. eWorkOrders opens up a whole new world of reports pulling data from as many or as few fields as needed." — Cynthia L., Office Coordinator, Hospital & Health Care — Verified Capterra Review.
CMMS Reporting for Every Industry That Runs Maintenance
Every maintenance-intensive operation benefits from accurate KPIs and reliable reports. Here is how reporting matters differently across industries.
Production floor maintenance reporting tracks OEE, MTBF per machine, and planned vs. unplanned ratios by line — data that connects maintenance performance directly to production output and downtime cost. Shift supervisors and plant managers see the numbers that matter to production decisions, not just maintenance activity counts.
Multi-building facilities teams use eWorkOrders reporting to track PM compliance, response time, and cost per square foot across all properties in a single dashboard view. Facilities directors can compare performance across buildings and identify which locations need attention — without contacting individual site coordinators or consolidating spreadsheets from each property.
Healthcare facilities use eWorkOrders compliance reporting to demonstrate that equipment maintenance meets JCAHO and CMS documentation requirements. PM completion reports and work order audit trails are available on demand — not assembled before a survey. Every maintenance record is timestamped and tied to a completed work order.
Food production and restaurant operations use eWorkOrders reporting to track equipment inspection compliance, PM completion rates, and corrective action history for FDA and HACCP requirements. Reports provide the documented evidence that regulatory audits require — available at any time, not recreated from memory before an inspection.
Treatment plant operations require detailed maintenance records for EPA compliance and permit documentation. eWorkOrders reporting tracks inspection completion, equipment service history, and corrective action by asset and location — producing the regulatory documentation required without separate record-keeping systems for each compliance requirement.
University and school district facilities teams use eWorkOrders reporting to track deferred maintenance, work order response time, and PM compliance across buildings. Reports support budget presentations to administrators and boards — presenting actual maintenance cost data, backlog volume, and asset lifecycle status rather than estimates.
Proven Results — Real Customers
"eWorkOrders has enabled us to become a data driven department. Our prior CMMS software could only tell us how many work requests/PMs we did. eWorkOrders opens up a whole new world of reports pulling data from as many or as few fields as needed. The speedometers and graphs on the Dashboard are great for a quick look."

Carmel

Streamlined Maintenance, Better Communication & KPI Insights with eWorkOrders
The use of the eWorkOrders platform has facilitated the management and streamlining of our operations and maintenance workflow. System features, coupled with the responsiveness of the eWorkOrders tec...

Streamlined Maintenance, Better Communication & KPI Insights with eWorkOrders
The use of the eWorkOrders platform has facilitated the management and streamlining of our operations and maintenance workflow. System features, coupled with the responsiveness of the eWorkOrders technical team to custom solutions, have enabled our company to increase productivity and efficiency, integrate data with other systems, improve facility maintenance communications, streamline our business processes, and perform continuous process improvement benchmarking through KPI analysis.
Carmel

Mario

How eWorkOrders Simplifies Asset Tracking and Maintenance Reporting
We have been able to get a master list of our assets, including VIN numbers, registration dates, and employees using them. Also, we have the ability to keep records of our PM’s in a more efficient mann...

How eWorkOrders Simplifies Asset Tracking and Maintenance Reporting
We have been able to get a master list of our assets, including VIN numbers, registration dates, and employees using them. Also, we have the ability to keep records of our PM’s in a more efficient manner while giving technicians more accountability. Keeping track of our expenses by assets and programs has been one of the main issues we have solved; the reports are clear and give upper management an easy glance at everything that is happening in the maintenance department.
The integration process was easy and straightforward, the program is easy to use and learn, and the program has multiple reports that give you the ability to look at your expenses from different angles.
Mario

Nahum

eWorkOrders Delivers Global Support and Customized Reporting for Businesses
The support and capability they have to accommodate to our needs worldwide, our business are not locate in USA continental so reporting from eWorkOrders varies from country to country, eWorkOrders hav...

eWorkOrders Delivers Global Support and Customized Reporting for Businesses
The support and capability they have to accommodate to our needs worldwide, our business are not locate in USA continental so reporting from eWorkOrders varies from country to country, eWorkOrders have been able to provide us with a proper response for all our needs, I know we have more challenges as a company, but so far they have met 100% the expectations and needs required
Nahum
Ready to See What Your Maintenance Data Is Actually Telling You?
Use the ROI calculator to estimate how much reactive maintenance is costing your operation — and what better visibility into KPIs and reporting would change.
Common Questions About CMMS Reporting, Dashboards, and KPIs
What maintenance managers typically ask before evaluating eWorkOrders reporting features.
What maintenance KPIs does eWorkOrders track?
eWorkOrders tracks MTTR (Mean Time to Repair), MTBF (Mean Time Between Failures), PM compliance rate, planned vs. unplanned maintenance ratio, work order backlog by age and priority, cost per asset, labor hours by technician, parts usage by job type, and schedule compliance. These are calculated automatically from work order and asset data captured during normal maintenance activity — no manual entry or separate calculation is required.
Can I build custom reports without IT support?
Yes — eWorkOrders includes a custom report builder that allows maintenance managers to design reports using the fields, filters, and date ranges relevant to their operation. You choose what data points to include, how to group them, and how to sort the results. Reports can be saved for reuse and scheduled for automatic distribution. No developer or IT involvement is required to create or modify reports.
Are the dashboards real-time or do they refresh on a schedule?
eWorkOrders dashboards are updated in real time. When a technician closes a work order, updates job status, or completes a checklist from mobile or desktop, the dashboard reflects the change immediately. There is no scheduled batch refresh — the data on screen represents the current state of operations, not a snapshot from earlier in the day.
Can I see reporting across multiple locations from one dashboard?
Yes — eWorkOrders supports multi-site reporting from a single dashboard. You can view KPIs and work order data combined across all locations or filter to a single site. Reports can compare PM compliance, backlog, and cost metrics side by side across facilities. This is particularly useful for organizations managing maintenance across multiple buildings, plants, or campuses.
Can reports be scheduled and sent automatically to stakeholders?
Yes — reports in eWorkOrders can be scheduled to generate and distribute automatically on a daily, weekly, or monthly basis. Recipients receive the report by email without needing to log into the system. This is useful for sending PM compliance summaries to facility directors, labor productivity reports to supervisors, or cost reports to finance teams on a regular cadence without manual intervention.
How does eWorkOrders calculate MTTR and MTBF?
MTTR is calculated from the open and close timestamps recorded on corrective work orders — the total repair time divided by the number of repairs over a selected period. MTBF is calculated from the asset's work order history — the total operating time between recorded failure events. Both metrics are updated automatically as work orders are opened and closed. They can be viewed per asset, per asset class, or across the full asset portfolio.
What does the planned vs. unplanned maintenance ratio measure, and why does it matter?
The planned vs. unplanned maintenance ratio shows what percentage of all maintenance work is scheduled and proactive vs. reactive and emergency-driven. The industry benchmark target is 80% planned, 20% reactive. NIST research shows that manufacturers relying primarily on preventive and predictive maintenance experience 52.7% less unplanned downtime than those relying heavily on reactive maintenance (Thomas & Weiss, NIST AMS 100-34, 2021). eWorkOrders tracks this ratio automatically from work order type classification and displays it as a trended metric — so you can see whether your program is becoming more proactive over time or still predominantly reactive.
Which eWorkOrders plan includes reporting and KPI tracking?
Core reporting features — pre-built templates, work order reports, PM compliance reporting, and basic dashboards — are included in all plans starting at the Starter plan ($380/mo). Advanced reporting features including custom report builder, KPI widgets, technician productivity reports, and scheduled report delivery are available in the Advanced ($480/mo) and Enterprise plans. All plans include unlimited users — no per-user report access fee.
Can eWorkOrders reporting support compliance audits?
Yes — because eWorkOrders captures work order data at the point of work, compliance reports draw from a complete and timestamped record of what was done, when, by whom, and with what outcome. PM completion reports, inspection records, and corrective action history are reportable at any time. This supports regulatory requirements under FDA, OSHA, ISO, JCAHO, CMS, EPA, and other frameworks without requiring separate documentation systems. Learn more about compliance documentation →
Maintenance Reporting & KPI Resources
Guides, references, and tools to help your team get more from maintenance reporting and KPI tracking.


Stop Managing by Gut Feel. Start Managing by Data.
Join Honda, McDonald's, Kings River Packing, and thousands of maintenance teams that measure their programs with eWorkOrders dashboards and KPI tracking. Get a demo configured around your facility type, asset mix, and the metrics that matter most to your operation.
All third-party statistics are sourced from publicly available, independently published industry research and are used for informational purposes only. eWorkOrders makes no warranty as to the accuracy of third-party statistics. Capterra, G2, GetApp, and Software Advice badge imagery is the intellectual property of their respective owners, displayed consistent with each platform's standard badge-use policies for verified software vendors. Unsplash photographs used on this page are licensed under the Unsplash License (unsplash.com/license), which permits free commercial use without attribution; attribution is provided here as a courtesy. eWorkOrders dashboard and product screenshots are owned by Information Services Group LLC and used with permission. eWorkOrders® is a registered trademark of Information Services Group LLC. No competitor names or trademarks are referenced on this page. |
1. Vanson Bourne / ServiceMax / Aberdeen Research. "After The Fall: Cost, Causes and Consequences of Unplanned Downtime." |
2. McKinsey & Company. "Digitally Enabled Reliability: Beyond Predictive Maintenance." mckinsey.com. |
3. Thomas, D. and Weiss, B. "Maintenance Costs and Advanced Maintenance Techniques in Manufacturing Machinery: Survey and Analysis." NIST AMS 100-34 (2021). |
4. Capterra, G2, GetApp. eWorkOrders user ratings and reviews. Accessed April 2026. Customer quotes are from verified platform reviews and are used with attribution to the review platform.